



Stats Tester, Easy statistics calculator

Description of Stats Tester, Easy statistics calculator
1. The max data number for each statistics is 100.
2. Each statistics method has useful [Help], [Example] and [Share] buttons.
3. Some tests have graph functions.
Detailed usage can be found in the "How to use" section below the list of statistics methods.
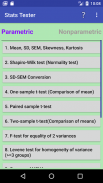
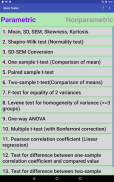
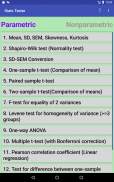
### Parametric statistics ###
1. Mean, SD, SEM, Skewness, Kurtosis
- Arithmetic, Geometric and Harmonic means
- Standard Error, Standard Deviation
- Confidence interval
- Sum
- Sum of Square
- Variance
- Skewness
- Kurtosis
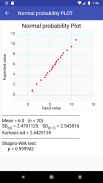
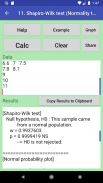
2. Shapiro-Wilk test (Normality test)
- Shapiro-Wilk test
- Normal probability plot (graph)
3. SD-SEM Conversion
4. One-sample t-test (Comparison of mean)
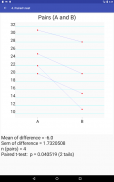
5. Paired sample t-test
6. Two-sample t-test (Comparison of means)
- F-test to compare 2 variances
- t-test(Student and Welch)
7. F-test for equality of 2 variances
8. Levene test for homogeneity of variance
(n >=3 groups)
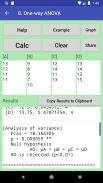
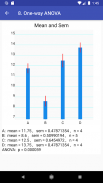
9. One-way ANOVA
10. Multiple t-test (with Bonferroni correction)
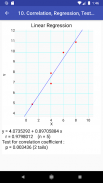
11. Pearson correlation coefficient (Linear regression)
- Correlation coefficient
- Regression coefficient
- Test for correlation coefficient
- Regression line (graph)
12. Test for difference between one-sample correlation coefficient and compared value
13. Test for difference between two-sample correlation coefficients
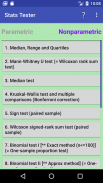
### Nonparametric statistics ###
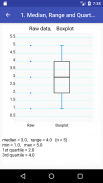
1. Median, Range and Quartiles
- Quartile deviation
- Boxplot (graph)
2. Mann-Whitney U test (= Wilcoxon rank sum test)
3. Median test
(Mood's Median test)
4. Kruskal-Wallis test and multiple comparisons (Bonferroni correction)
5. Sign test (paired sample)
6. Wilcoxon signed-rank sum test (paired 2 groups)
7. Binomial test I [** Exact method (


